Chart editor
Charts can be automatically built from data series extracted with the TranzAI query builder.
Chart editor
You can create and design charts from your project environment.
The chart editor provides a no-code environment to dynamically filter data and create visualization patterns for data analysis.
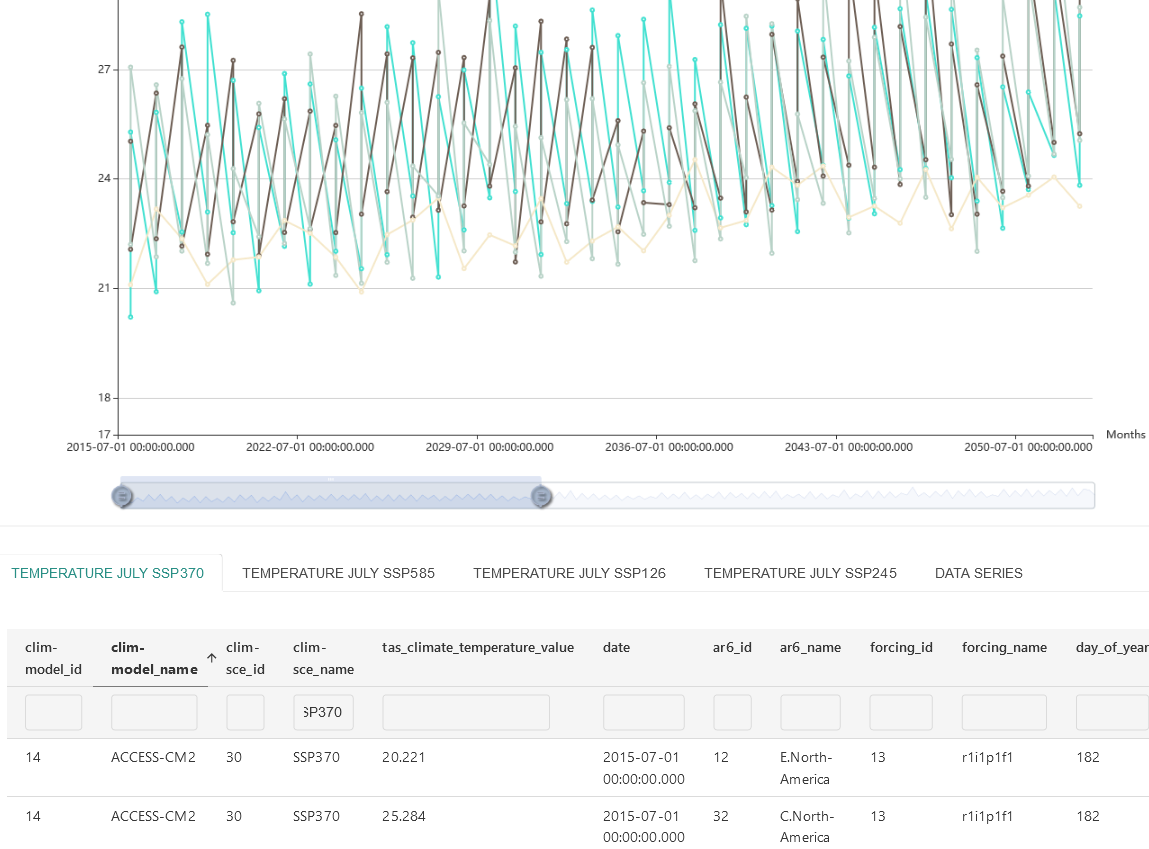
The preview window makes it easier to build your charts one step at a time and get immediate visual feedback on data and design options.
Data analysis dashboards
Charts created inside a project environment can be associated with dashboards that provide comprehensive data analysis for a given topic/entity.
Chart management workflow
Query design
The conception of a chart always starts with the design of the associated queries. How you design your SQL queries will affect the structure and organization of the data extracted, which will, in turn, impact the visualization of that data in charts and dashboards.
Data sets management
At the chart level, you can extract data sets from the query associated with your chart. This functionality facilitates the customization of your chart to create insightful analytics dashboards. Creating data sets is a no-code feature that applies filters to your queries. The description of each dataset is used to generate appropriate styling and legends.
Layout and style
The layout of your graph is managed in a dedicated interface which offers the possibility of defining the scale and units of the axes, as well as legends and labels.