TranzAI EO feature extraction pipelines
Spectral index aggregates
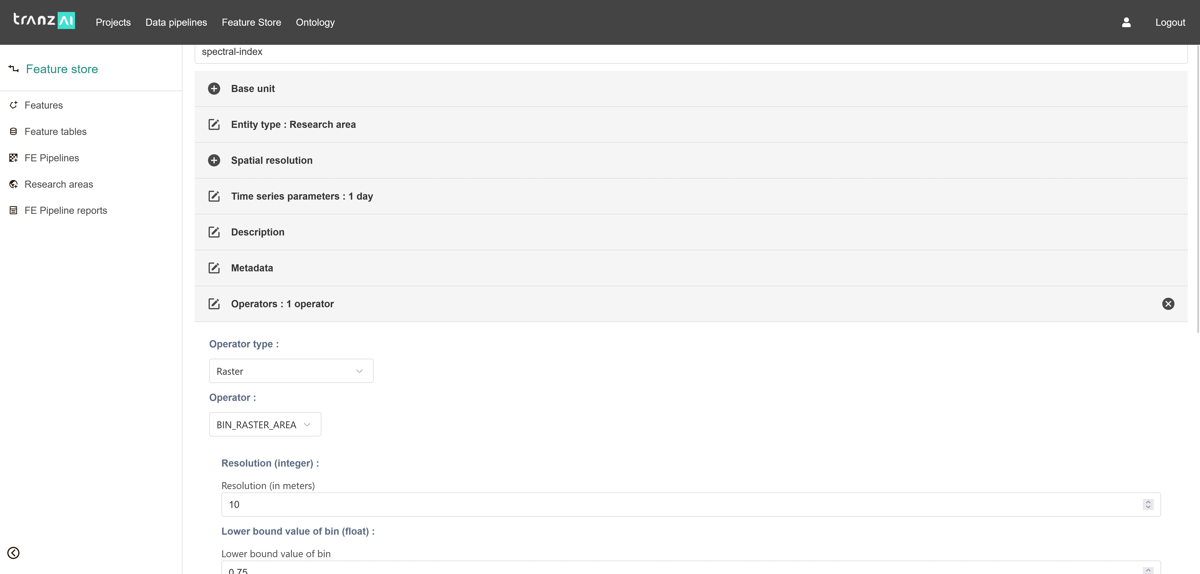
Spectral index aggregates can provide valuable information for a range of earth observation applications, by capturing trends and patterns in the data that may not be visible from individual images. They can be defined as feature in the TranzAI feature store environment.
By converting spectral index information into aggregates stored in feature tables, you have the ability to analyze spectral index information at specific locations and times and can use all of the statistical tools available in TranzAI to analyze trends and patterns. These data points also become available as features that can be used in training data sets for machine learning.
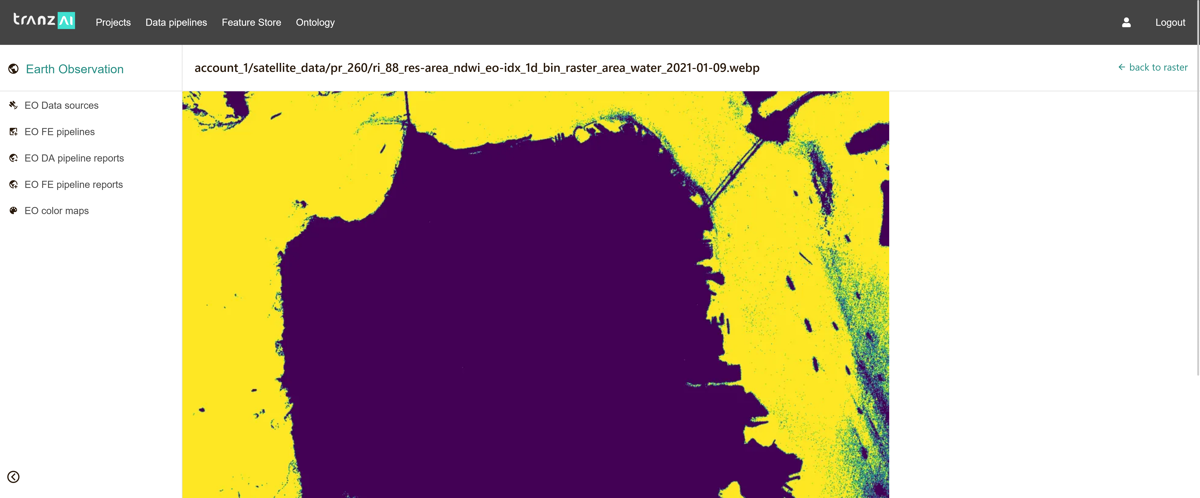
Users have access to specific raster operators to define EO features that can be extracted from geotiff files.
Spectral index temporal features
Once spectral index aggregates are available in feature tables, you can use all the components of the feature store to derive higher level features and refine your spatiotemporal analysis. At this point in your project workflow, EO related data is pure digital data that can be combined with other data sources, especially ground sensor data. They can be used as standard spatiotemporal time series for machine learning.
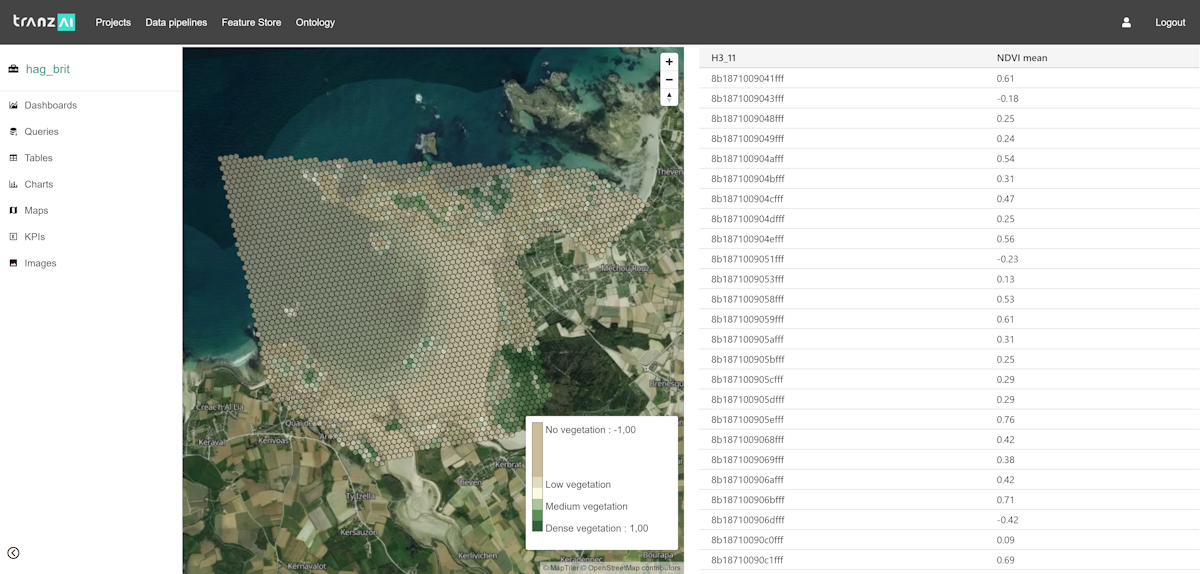
Spectral index features visualization
ESDA (Exploratory Spatial Data Analysis) is facilitated by the ability to visualize spectral index features as images that can be integrated into EO analysis dashboards. With the TranzAI platform, you easily convert geotiff data into data tables and parquet time series, and vice versa.