TranzAI EO spectral indices
Spectral index ontology
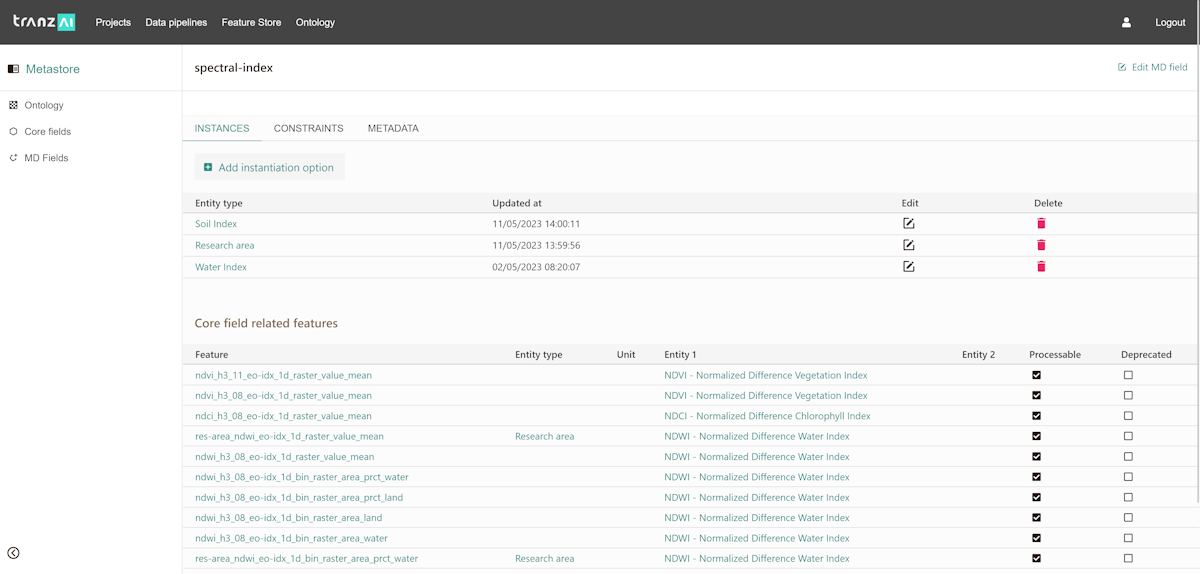
Spectral indices are part of the ontology created by TranzAi for earth observation applications. Integrating the scientific definitions of spectral indices inside an ontology managed in the TranzAI platform provides several benefits:
- Spectral indices can be integrated in the master data and used to define features derived from raw spectral indices data (ex: percentage of dense vegetation in a given area).
- Since the ontology is the only source of truth for spectral feature definitions and calculation formulas, there can be no confusion as to how they can be used when processing raster data.
- New indices can be easily added to the ontology when scientific papers present new indices of interest for the TranzAI platform users.
Spectral index extraction
Since the TranzAI SDK is directly connected to the ontology manager, the instantiation of the data pipelines necessary for the extraction of the spectral indices is simple and entirely managed via a no-code interface.
Simply select the spectral index you want to extract from a given raster dataset and run the pipeline which will perform the feature extraction and save all the metadata of the new asset which is now referenced in your data store for analysis or future data enrichment processes.
Note
You can also extract time series of spectral indices by using your EO data acquisition pipelines parameters to extract all indices over the date range associated with your pipeline.
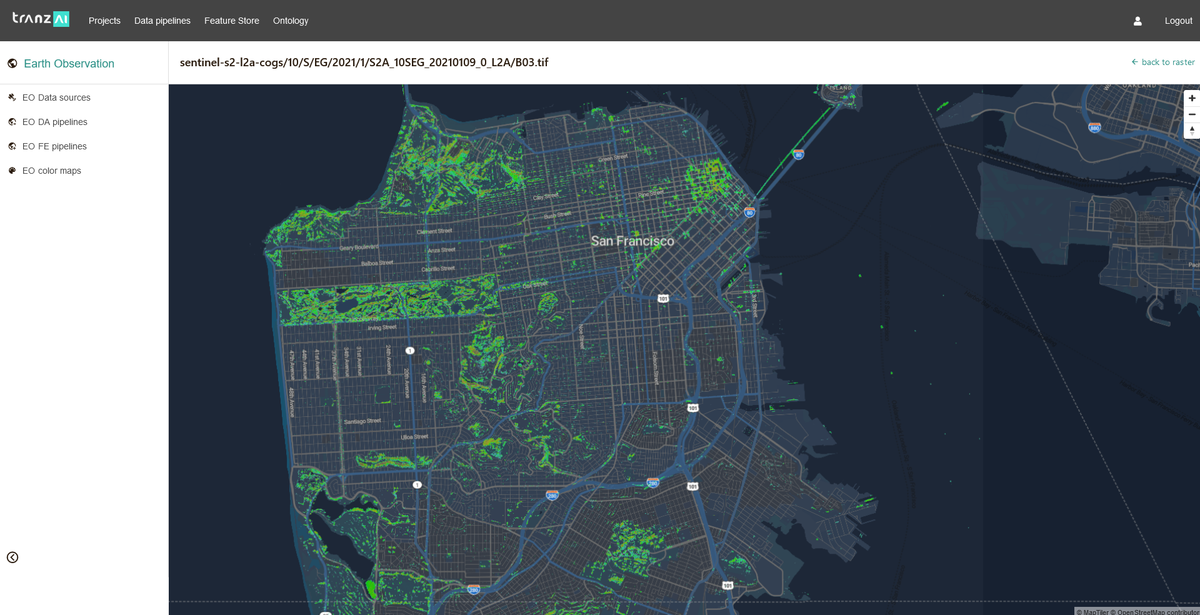
Spectral index visualization
You can visualize spectral indices with the raster image viewer. To facilitate the analysis of data you can design color maps that you associate to each type of spectral index in order to optimize the rendering. Mapping the values of a spectral index to a range of colors can make it easier to visualize and interpret the data.